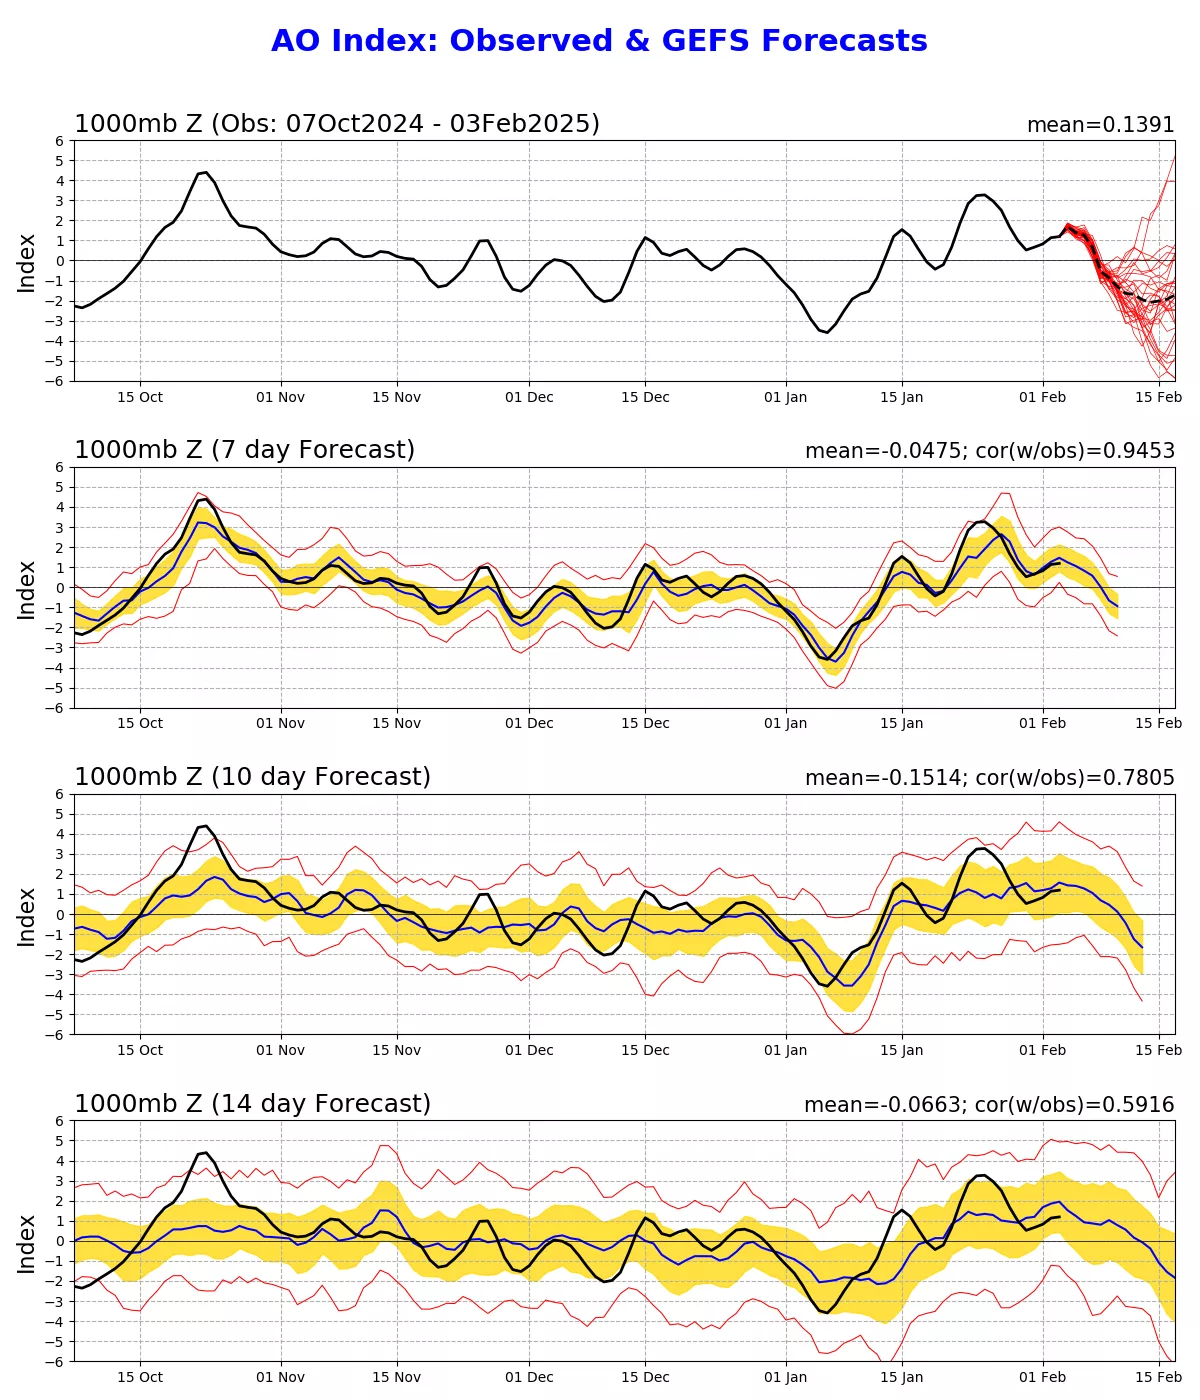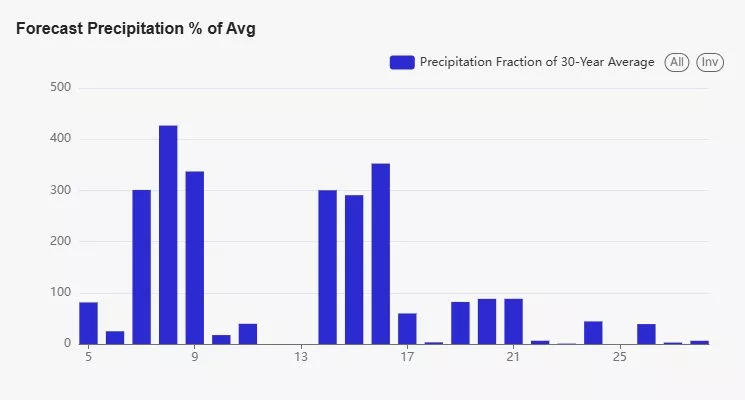


Good morning everyone! I had mentioned before that one piece of data that I utilize throughout the winter months is the AO (Arctic Oscillation) chart. This chart shows how strong the cold, Arctic air is wound up at the North Pole. If it is in the positive phase, that means the air pressure is very strong and tightly together at the Pole. The jet stream has a hard time tapping into that cold air and driving it south into the USA. If it is in the negative phase, that means that the pressure is weaker, and the jet stream can pull some of that cold air and drag it down into the Central Plains. The latest data shows the AO turning negative in the second half of the month (picture 1). We have also been talking about the potential of a storm system coming in around Valentine’s Day. In picture 2, you will see a chart from Weather 20/20 and the LRC still showing way above average precipitation expected Feb 14th-18th. I am still watching this closely as we will be in the “battle grounds” of the 2 air masses here in WCMO. Another wonder of the LRC is that our last big winter storm came on Jan 5th, which was day number 10 of the 2nd cycle of the LRC. February 14th will be the 10th day of the 3rd cycle of the LRC. Absolutely crazy how accurate the LRC can be! So alot to watch for here over the next couple weeks. Make sure to stay up to date on all of our social media platforms. Subby